ONS Labour Market October 2022
Fourth consecutive fall in vacancies
- The number of job vacancies in August to October 2022 was 1,225,000 – a decrease of 46,000 from the previous quarter.
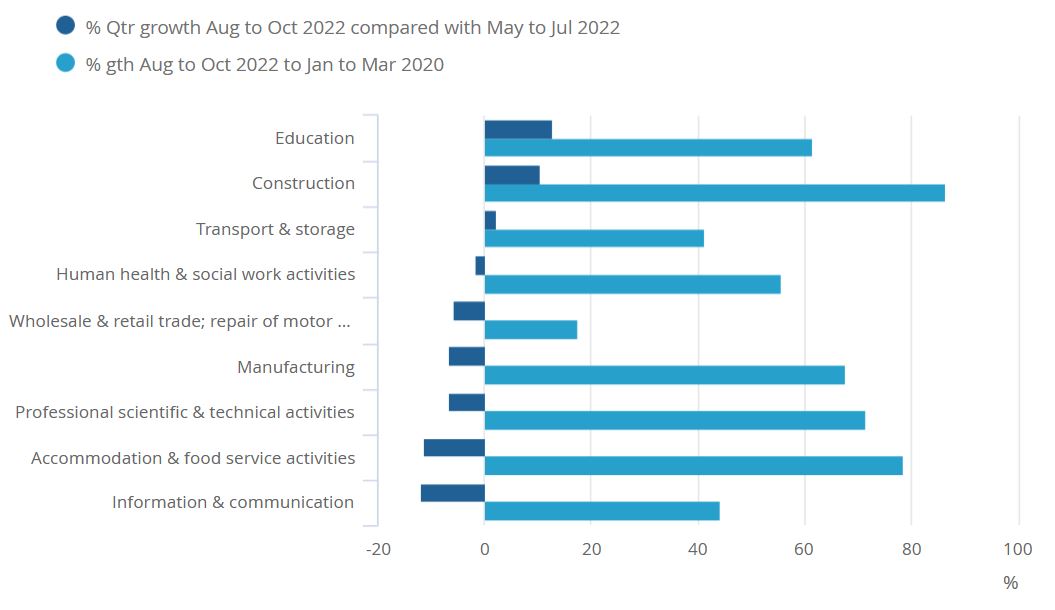
- Although this marks a fourth consecutive quarterly fall, the number of vacancies remain at historically high levels and 429,000 (54%) above the January to March 2020 pre-Covid level, contributing to a tight labour market.
- But the ONS said an increasing number of businesses are holding back recruitment because of economic pressures.
- The sectors facing the largest falls in job openings were accommodation and food service activities, down 19,000, followed by professional, scientific and technical activities, and wholesale and retail trade; repair of motor vehicles and motorcycles, both down by 9,000 on the quarter.
- Education and construction saw the largest increases in vacancies, up by 9,000 and 5,000 respectively on the quarter.
August to October 2022 three-month average vacancies in the UK, quarterly percentage growth from May to July 2022 and percentage growth from pre-coronavirus (COVID-19) pandemic January to March 2020

Source: Office for National Statistics
Payrolled employees continue to rise
- Early payroll estimates for October show the number of payrolled employees rose by 772,000 employees (2.7% YoY) to 29.8 million.
- On the previous month, the number of payrolled employees rose by 0.2% (74,000).
- The largest yearly increase in payrolled employees was in the professional, scientific and technical sector (a rise of 117,000 employees) and smallest in the wholesale and retail sector (no rise).
Sickness drives inactivity
- The unemployment rate for July to September decreased by 0.2pp on the quarter to 3.6% – 0.4pp below pre-pandemic levels.
- The economic inactivity rate increased by 0.2 percentage points on the quarter to 21.6% in July to September, driven by long-term sickness hitting a record high, with 465,144 inactive because of sickness compared to three years ago.
Second jobs increases
- The employment rate for July to September remained unchanged at 75.5% and still 1.1pp below pre-pandemic levels.
- The number of people with second jobs increased slightly during the latest three-month period, up 29,000 to 1.252 million.
Working days lost to strikes
- Total actual weekly hours worked decreased by 4.2 million hours compared with the previous quarter to 1.04 billion hours in June to August.
- This is 13.3 million below pre-pandemic levels (December 2019 to February 2020), driven by women, although the total actual weekly hours worked by women continues to exceed pre-pandemic levels.
- By comparison, average actual weekly hours worked have returned to levels like those seen before the coronavirus pandemic. It means that the shortfall in total actual weekly hours is a result of fewer people in employment.
- Additionally, August and September saw well over half a million working days lost to strikes – the highest two-month total in more than a decade.
Inflation outpaces earnings
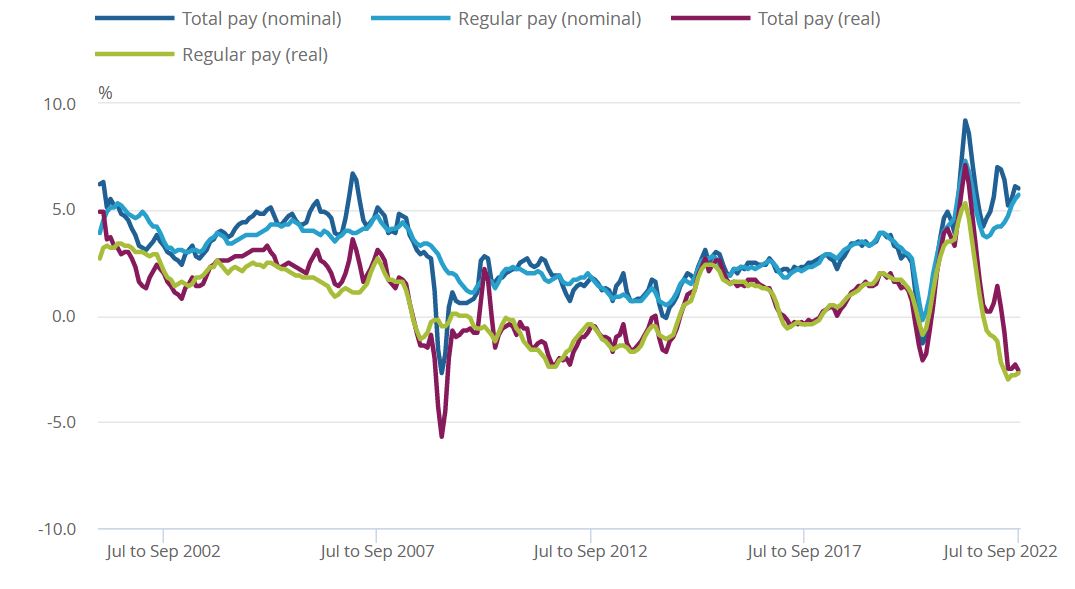
Both annual total and regular pay growth lagged inflation in the three months to September:
- In nominal terms, average regular pay (excluding bonuses) for employees in Great Britain was £578 per week before tax and other deductions from pay – up from £545 per week a year earlier.
- Average total pay (including bonuses) for employees in Great Britain was £621 per week before tax and other deductions from pay – up from £586 per week a year earlier.
- Regular pay rose at its strongest growth rate outside of the pandemic at 5.7% YoY in the three months to September. Total pay growth rose by 6.0%.
- Average regular pay growth between the private and public sector widened. The private sector saw 6.6% YoY growth in the three months to September, while the public sector saw just 2.2%. The wholesaling, retailing, hotels and restaurants sector continued to see the largest growth rate at 7.3%.
- In real terms (adjusted for inflation), total pay declined by 2.6% in the three months to September and regular pay declined by 2.7% over the period.
Average weekly earnings annual growth rates in Great Britain, seasonally adjusted, January to March 2001 to July to September 2022

Source: ONS
Back to Retail Economic News