ONS Retail Sales February 2024
- Retail sales (value, non-seasonally adjusted, exc. fuel) rose by 4.8% year-on-year (YoY) in January according to the latest ONS data, compared to a 3.0% rise a year earlier.
- In volume terms (non-seasonally adjusted, exc. fuel), retail sales edged up by just 0.4% YoY in January following December’s sharp 2.9% decline. It compares to a weak 6.3% decline in January 2023. Volumes in January 2024 were only 1.5% higher than January 2019 levels.
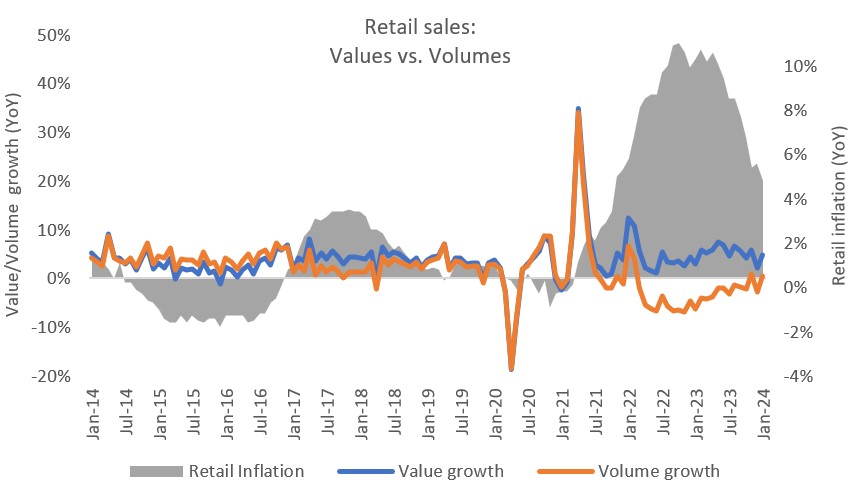
- It should be noted that ONS figures are based on a sample of some 5,000 retailers and are subject to revisions. Retail sales value and volume growth has detached – percentage change on a year earlier.
Retail sales volumes broadly flat in January

Source: ONS, Retail Economics analysis
Note: all retail sales figures provided below are non-seasonally adjusted, excluding Fuel, unless stated otherwise.
Food and non-food
- Food sales values rose by 6.7% YoY in January (versus an 8.7% rise a year earlier). Adjusting for easing inflation, volumes were broadly flat at 0.1% in January against a 4.2% decline in the previous year.
- Non-food sales values grew by 2.6% in the month compared to a 3.1% rise in the previous year. In volume terms, growth was broadly flat at -0.1% following a 3.9% decline in December.
- Clothing sales values declined for a second consecutive month, falling by 3.4% in January. Accounting for inflation, volumes decreased by a substantial 8.5% in the month.
- Household Goods remained in decline in January. Both values and volumes declined by 1.1% in the month, with Furniture and Lighting volumes down by 2.4%.
Online
- Online sales values rose by just 1.1% YoY in January, against a soft 6.6% decline a year earlier.
- Clothing & Footwear dragged growth, declining by a sharp 19.4% in January, while Household Goods faced a 2.7% decrease.
- Non-store retailing (a proxy for pureplay retailers) rose by 4.9% YoY in the month, against a weak 11.6% decline a year earlier.
- The proportion of retail sales made online slipped to 26.3% in January, compared to 27.3% a year earlier.
- Overall, average weekly online sales were £2.14bn in January, up from £2.12bn a year earlier.
- It should be noted the ONS updated its sample for January. This update may have affected the proportion of sales made online, which is more sensitive to sample changes than other parts of retail sales. This may therefore be subject to more revision than usual.
Retail sales price deflator
- The retail sales deflator (a measure of inflation specific to retail) rose by 4.4% YoY in January when excluding fuel – the weakest rate since October 2021 – and rose by 3.1% when including fuel.
- The implied price deflator among food stores remained elevated at 6.6% YoY in January, but continues to soften from a peak of 14.6% in April. Among non-food stores, the price deflator eased to its softest level since July 2021 at 2.7% in the month.
Back to Retail Economic News